Facebook posts report
Retrieve the metrics of your Facebook posts
 100% spreadsheet
 Connected to your data
 Daily+ refresh
 Embed everywhere
About Facebook posts report
Monitoring the performance of your Facebook posts is not easy. There is no intuitive way of doing it and the automatic alternatives are expensive and hard to configure. That's why many people end up doing it manually, export data into different spreadsheets and analyze it very inefficiently.
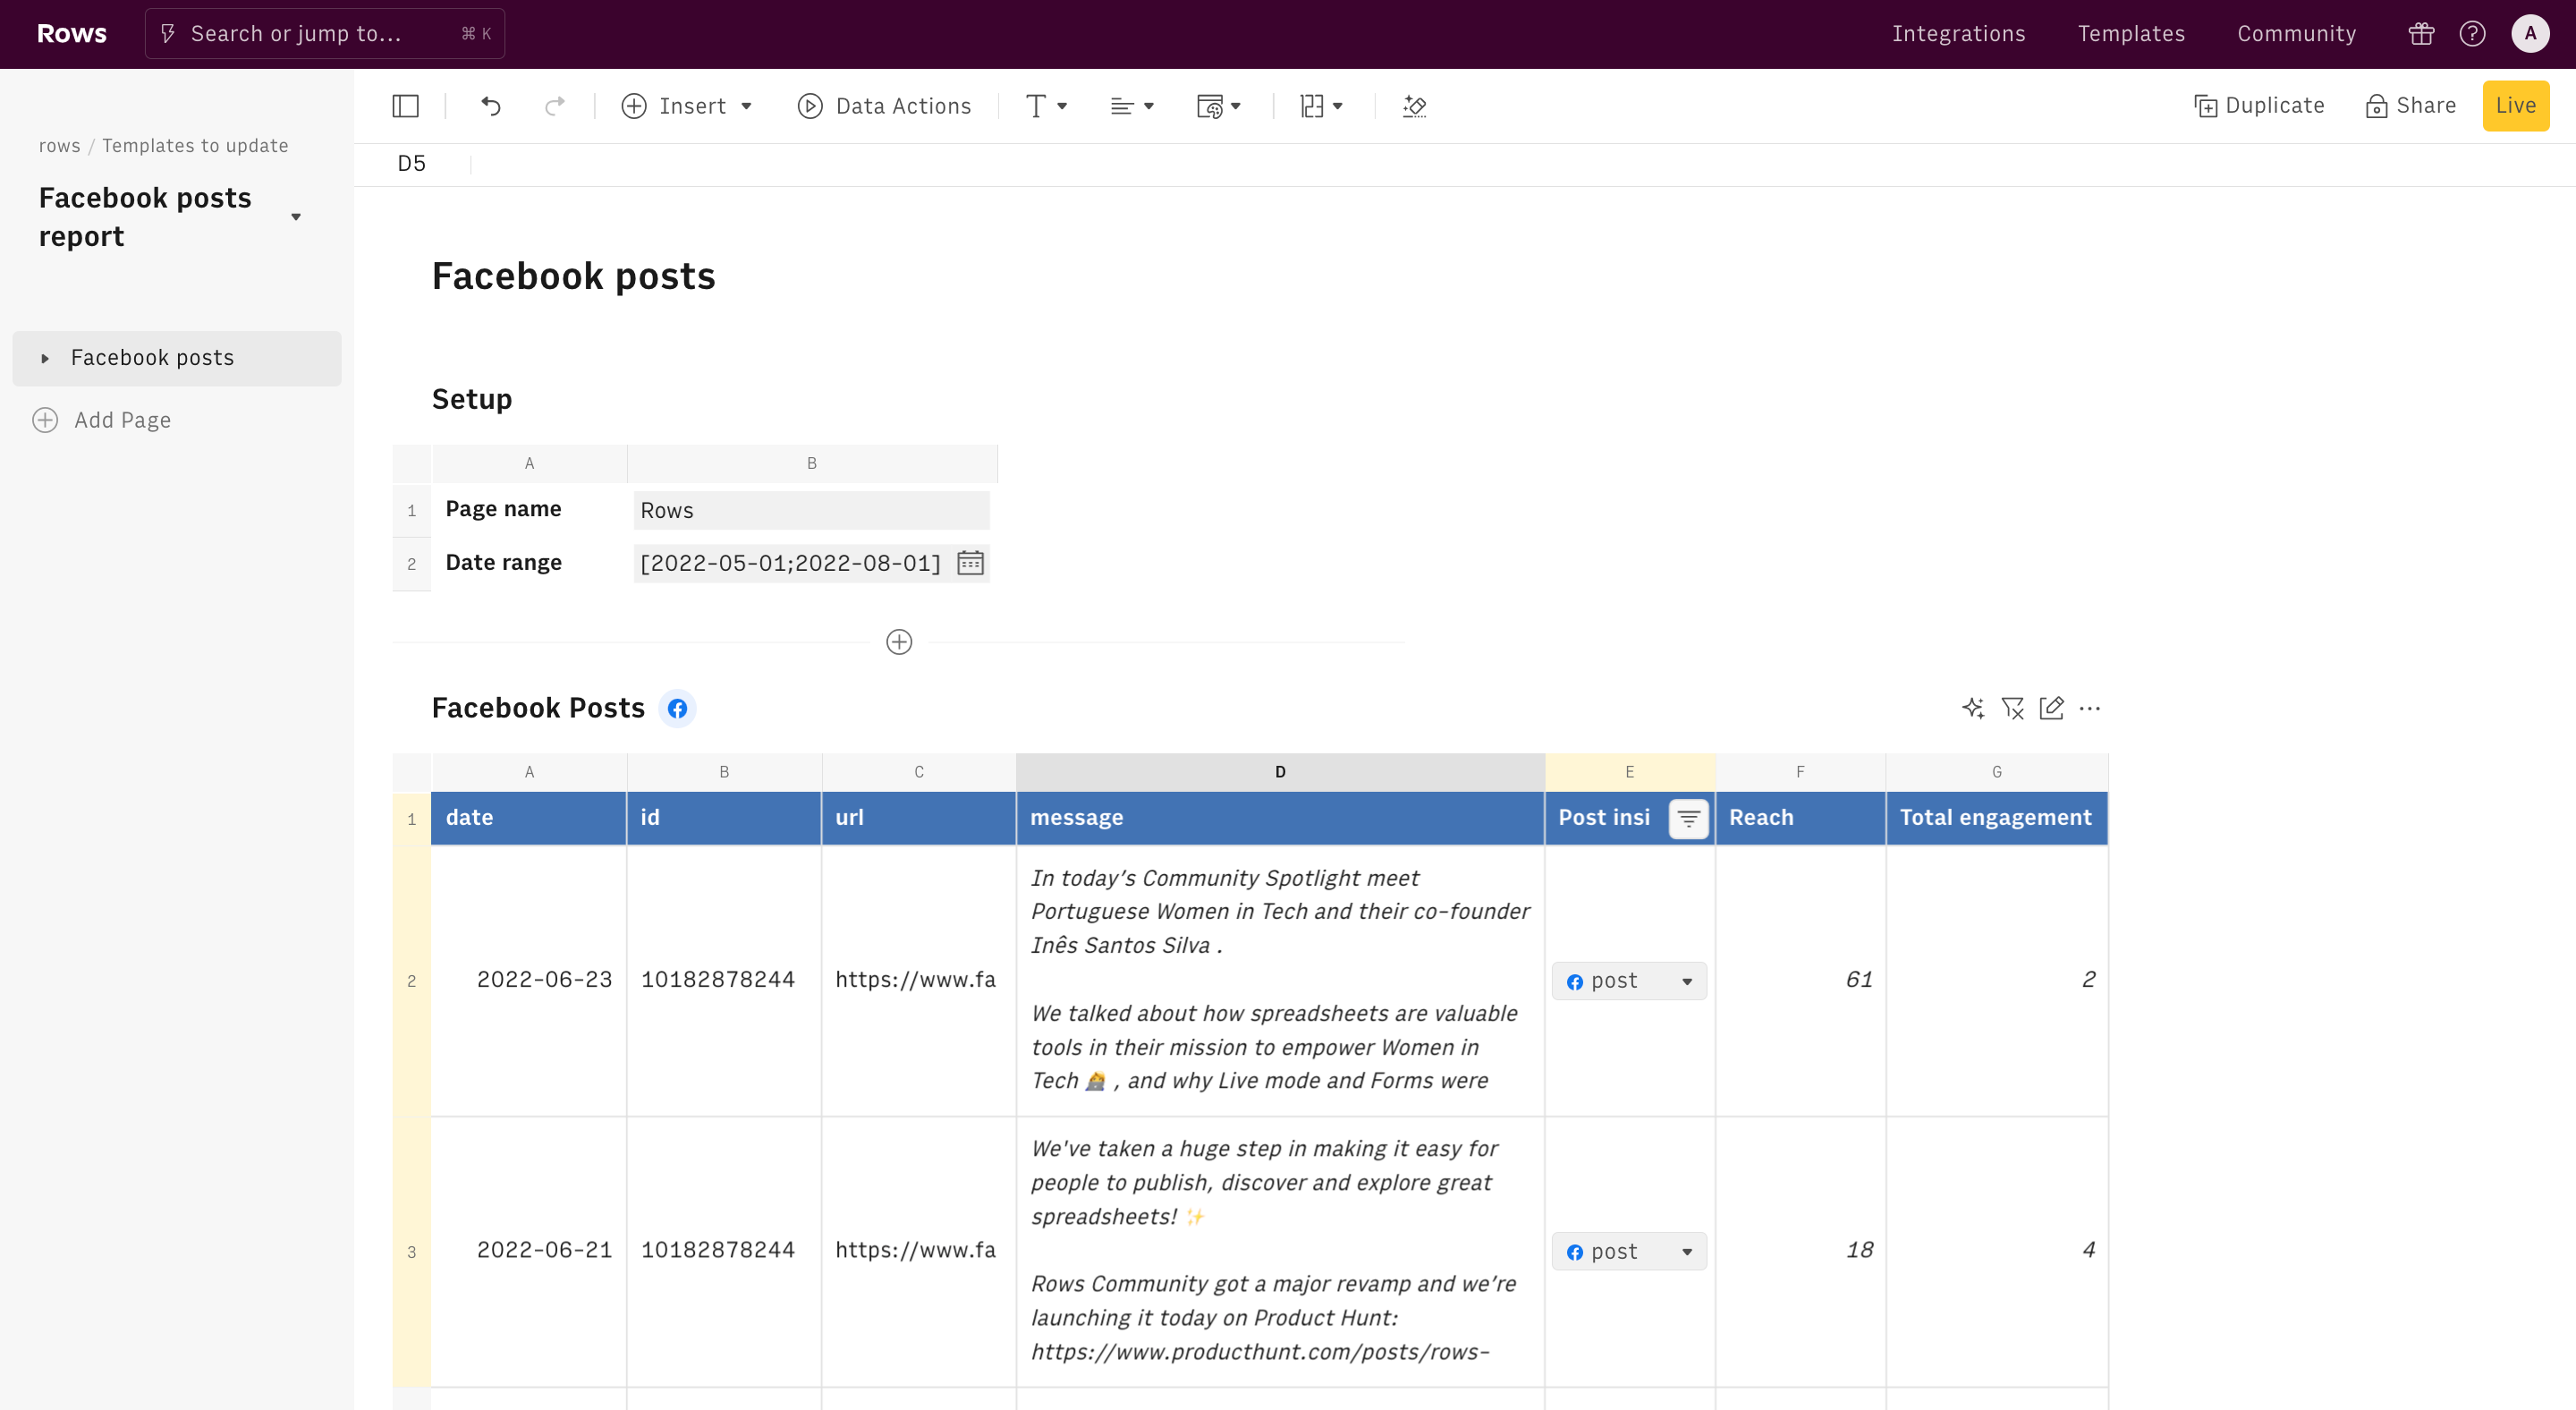
This template automates this process, all in a spreadsheet. You only need define your Facebook page username and date range and it will retrieve the post metrics and automatically generate the performance report for you.
- Enter the username of your Facebook page.
- Enter the date range you want to retrieve the posts from.
- The Facebook function will retrieve the posts and display them.
- The Facebook function will also retrieve the posts metrics.
- You can adjust your report by adding or changing the list of metrics to retrieve.
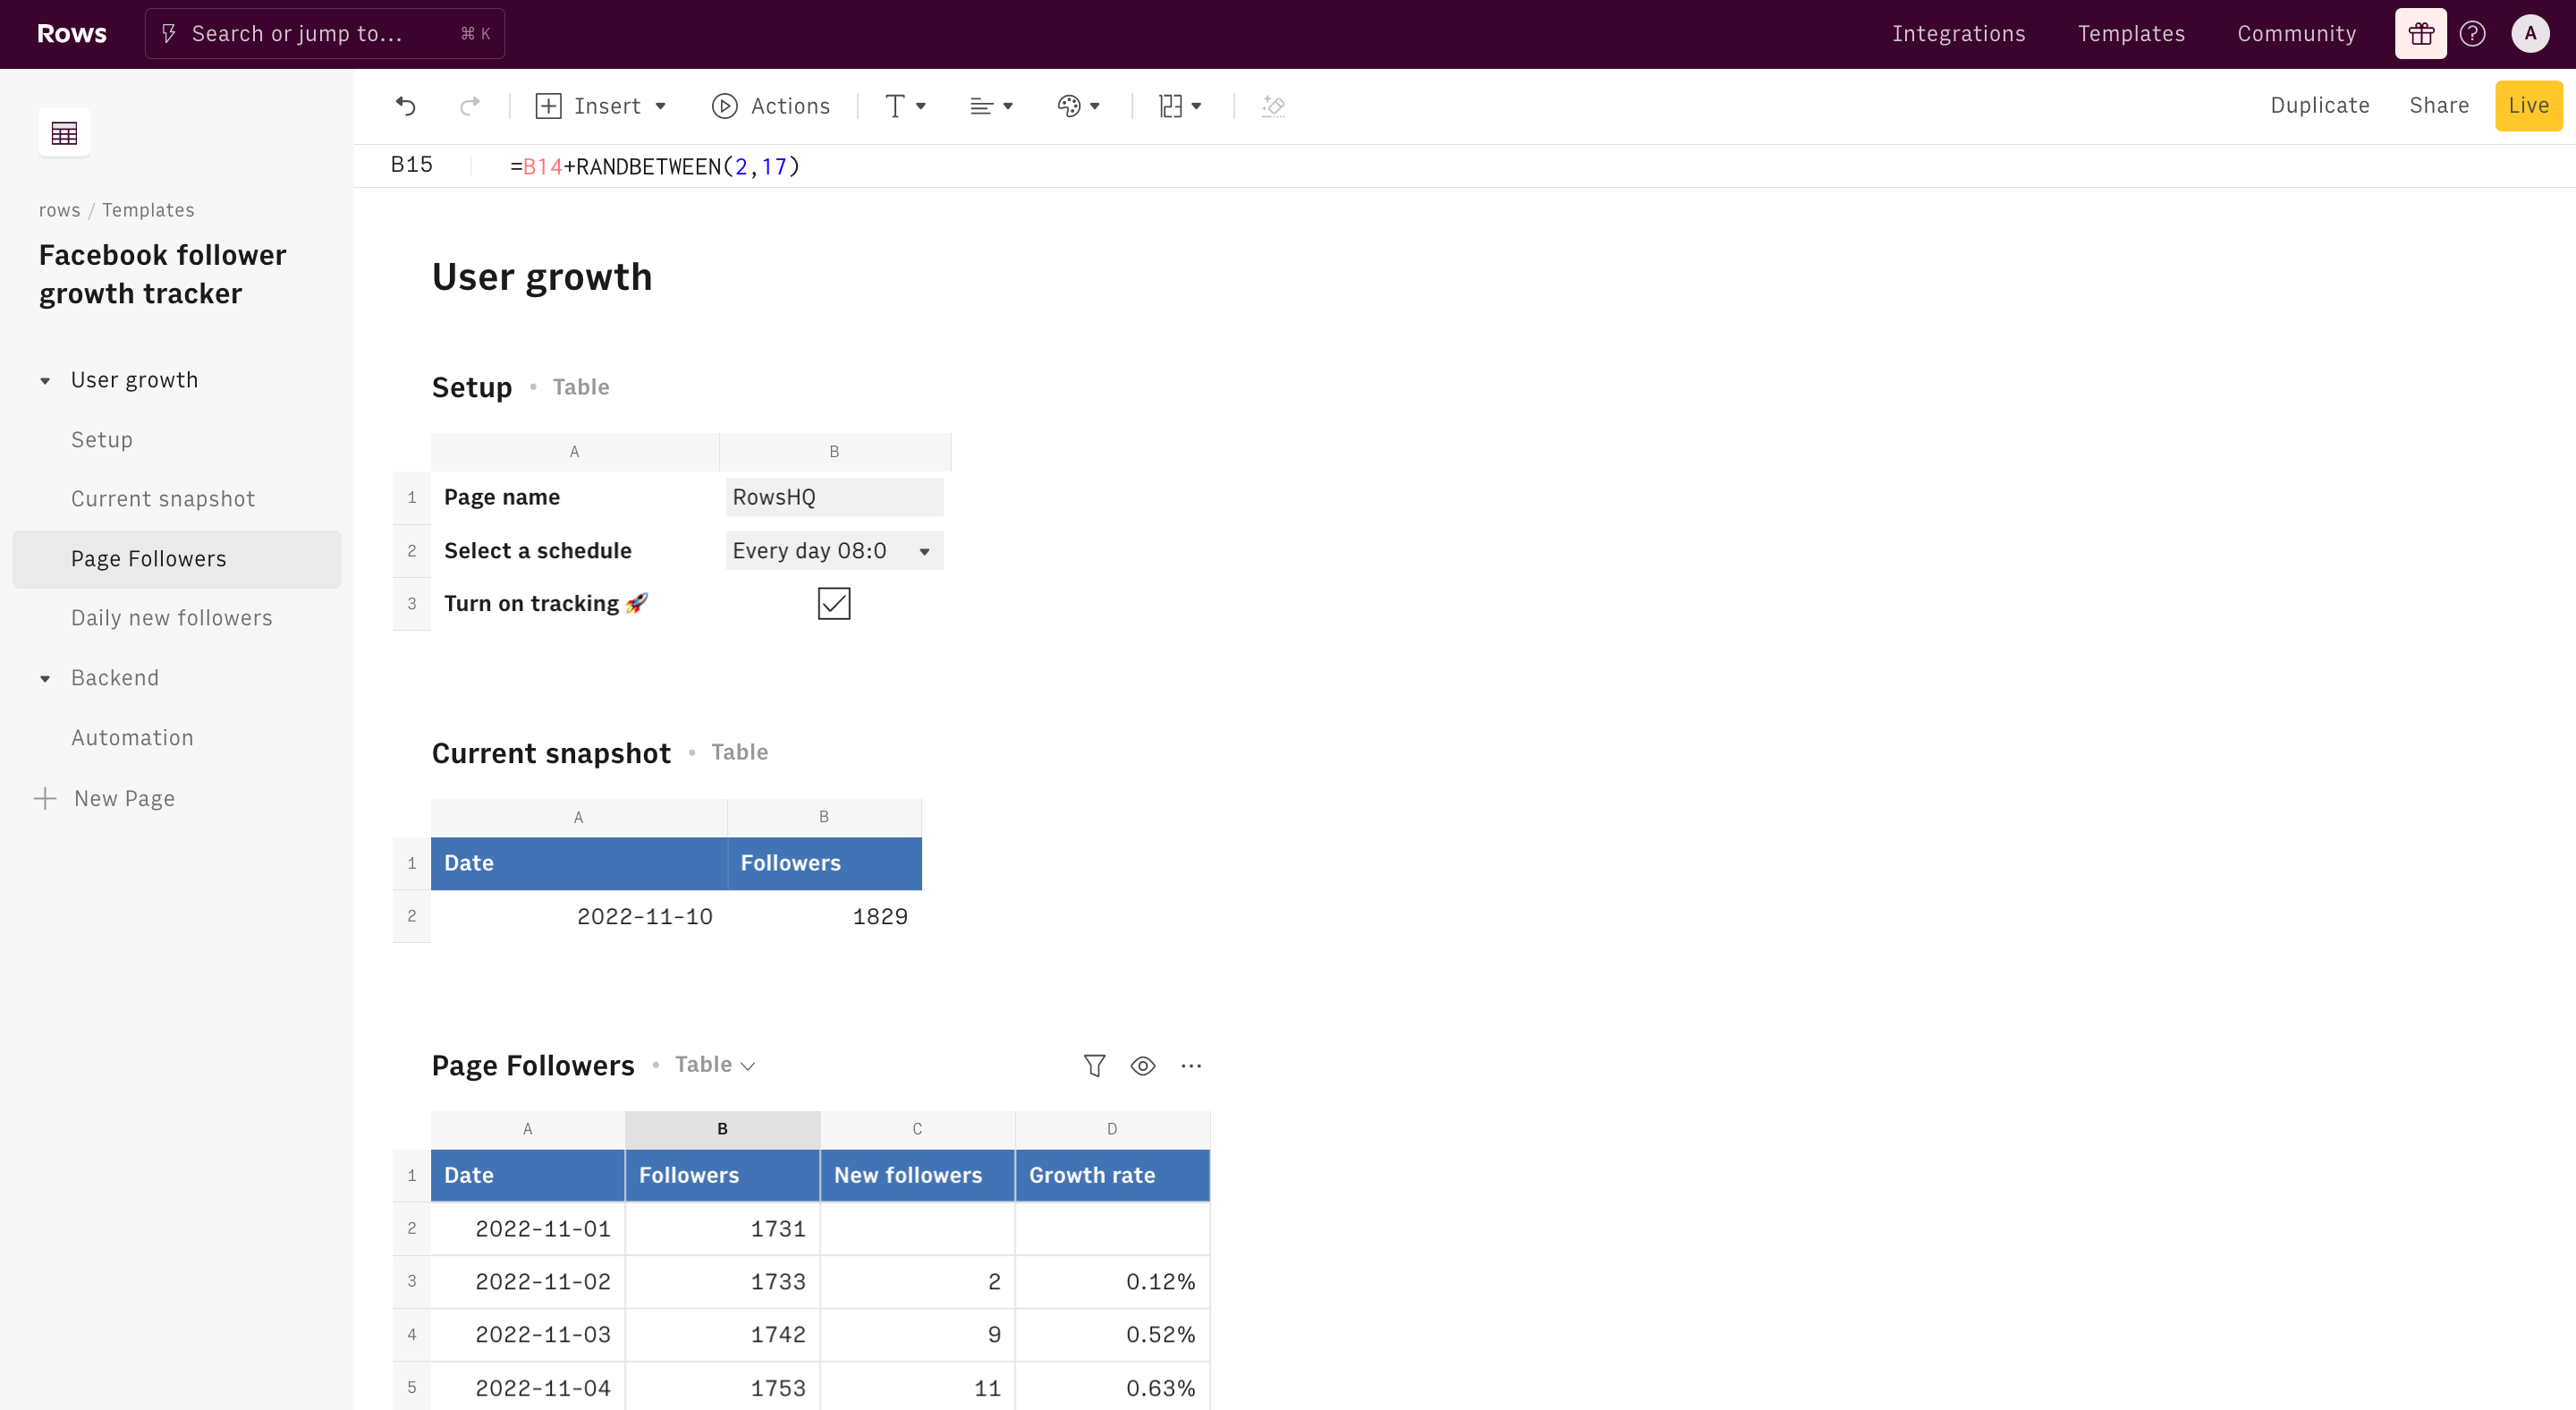
How it works


How it works
Get started
Click on 'Use template' and start using it right away. No forms, no signup. Your data first.
Connect your Facebook account
Once landed on the spreadsheet, follow the instructions to connect the required integration and pick your account.
Customize the template and schedule refresh
Once the integration has been connected, all tables will update automatically with your own data. Click on 'Edit Source' to change the retrieved data and automate the data refresh. You can then insert a chart or a pivot table, add a column or personalize formats, using all the regular functions and shortcuts that make spreadsheets great.
Embed tables and charts
Click on the option menu to embed tables and chart on your Notion, Confluence or any other iframe-ready documents.


Questions and answers
Can I use Rows for free?
More than a Facebook posts report
Rows is the easiest way to import, transform and share data in a spreadsheet.
Signup for free
Import data from anywhere
Unleash your data: import from files, marketing tools, databases, APIs, and other 3rd-party connectors.
Know moreAnalyze with the power of AI
Unlock the power of AI on your data: ask the AI Analyst ✨ any question about your dataset and surface key insights, trends, and patterns.
Know moreCollaborate and Share
Seamlessly collaborate and share stunning reports with dynamic charts, embed options, and easy export features.
Know more